Rectangle Clustering
One of the marking tools available through the PFE is rectangles. This allows users to outline a rectangular region of an image. A rectangle is just a special type of polygon and in fact you can basically use polygon aggregation on rectangles. This turned out to be overkill and rather slow so we created a clustering technique specifically for rectangles. The code for clustering rectangles is in rectangle_clustering.py. Rectangles are now treated as regular points - we reduce each rectangle to a 2-d value, i.e. the center of the rectangle and then do normal agglomerative clustering. The advantage of this approach is that it can handle overlapping entities.
You could also use rectangles to mark regions (i.e. mark out a region of grass) - basically like polygons but probably faster. This originally what I thought rectangle markings would be used for. For this “area” use of marking, there really isn’t the concept of overlapping entities. The code to do this type of area marking is still in rectangle.py and the explanation is given down below. Currently, the aggregation engine is set up to only do the entity type of clustering/aggregation. It might be nice to support both types (although you could always just get people to do polygon markings) but the aggregation engine doesn’t really support doing two different types of aggregation for the same marking tool.
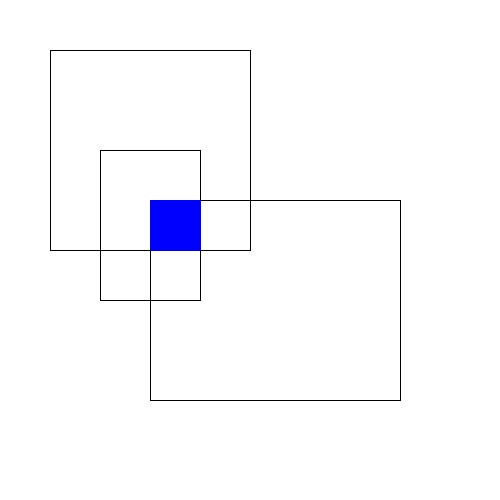
The idea behind rectangle clustering is to find regions that multiple people have outlined. For example, the image below shows 3 overlapping rectangles and the region common to all 3 rectangles is shown in blue.
There are two different ways projects might use the rectangle tool. The following examples should illustrate the difference.
- A project might ask users to use rectangles to outline all of the grass in each subject. So in the above example, there is considerable disagreement about where the grass is but the users do agree that there is grass in the blue region.
- A project might ask users to outline each zebra in an image. This time with the above example, the 3 rectangles are so different that they are probably referring to different zebras and the blue region isn’t really a good aggregated result (since it doesn’t really refer to anything)
These are two very different uses of the rectangle tool. Currently the aggregation code handles the first case. If we wanted to handle the second case, we would probably need to convert each rectangle into a point marking (the center of the rectangle). We would then use normal point clustering. Once we had our cluster of points, we would revert back to rectangles and take the median values of each corner. (Both cases could probably be supported - that would mean having some confusing csv output. So people would get csv results for both cases and they might not understand the difference, or every why there are two cases. Good documentation would be essiental.)
Checking for overlap between rectangles is easy. Two rectangles overlap if and only iff
- They overlap on the x-axis.
- They overlap on the y-axis.
Checking for overlap on either axis is straight forward:
def __overlap__(self,l1,l2):
    (l1_a,l1_b) = l1
    (l2_a,l2_b) = l2
    # l2 ends before l1 begins
    if l2_b < l1_a:
        return False
    # l2 starts after l1 ends
    elif l2_a > l1_b:
        return False
    else:
        return True
We can express the overlap relationship between rectangles as a graph; each node is a rectangle and there is an edge between nodes iff the corresponding rectangles overlap. With this setup, the above rectangular markings can be represented in the below image
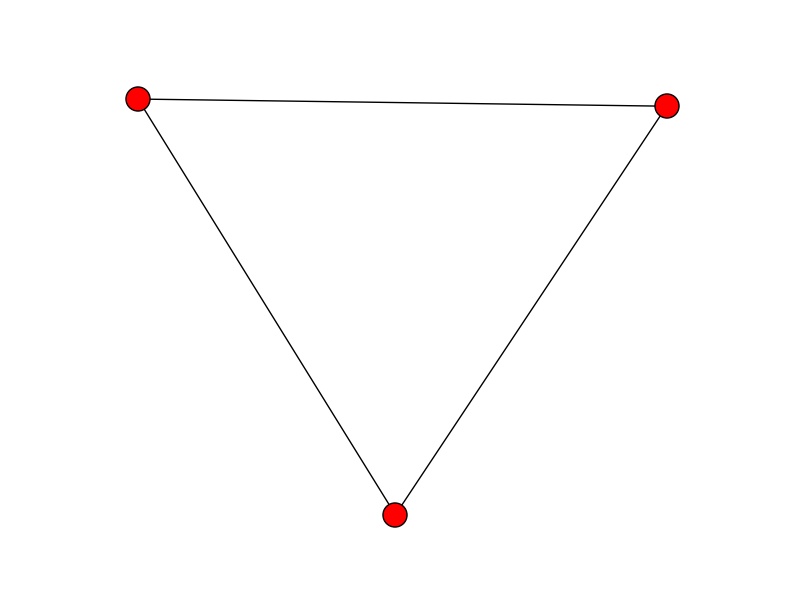
A set of nodes where every pair of nodes is connected is called a clique. There are actually multiple cliques in the above graph - for example a node by itself is a trivial clique. We want maximal cliques - cliques that are not a subset of another clique. Finding all maximal cliques seems to be an intractable problem. So in the worst case, this clustering algorithm could take a long time - but in practice things should be fine. (I can’t imagine more than 50 rectangles per subject and the graph structure should be pretty simple. But if things ever start to run really slowly, this is a place to check.) Because Python is awesome, the code to create a graph, enter edges and enumerate the maximal cliques is just:
import networkx
g = networkx.Graph()
g.add_nodes_from(range(len(markings)))
g.add_edge(i,j)
cliques = list(networkx.find_cliques(g))
Each clique represents a cluster of rectangles. To get the “centroid rectangle” for that cluster (the single rectangle which represents that cluster) - we than take median value for each corner.